3.2 Interpreting MTI

3.2 Interpreting MTI

Radar data used to form SAR images can be processed into other products, including MTI.  With some basic understanding, MTI products are easy to interpret and enable users to more quickly and effectively advance their missions.

MTI modes provide detections and tracks that indicate the location, direction, and speed of moving targets. Using advanced processing, MTI modes can detect slow-moving targets by extracting data from the surrounding clutter. These indicators enable a user to monitor the activity of several targets over a large area. MTI can be used on land or sea, for a wide range of target sizes including vehicles, dismounts (people), large vessels, and even small targets like fishing boats, RHIBs, and rafts. 

Key:

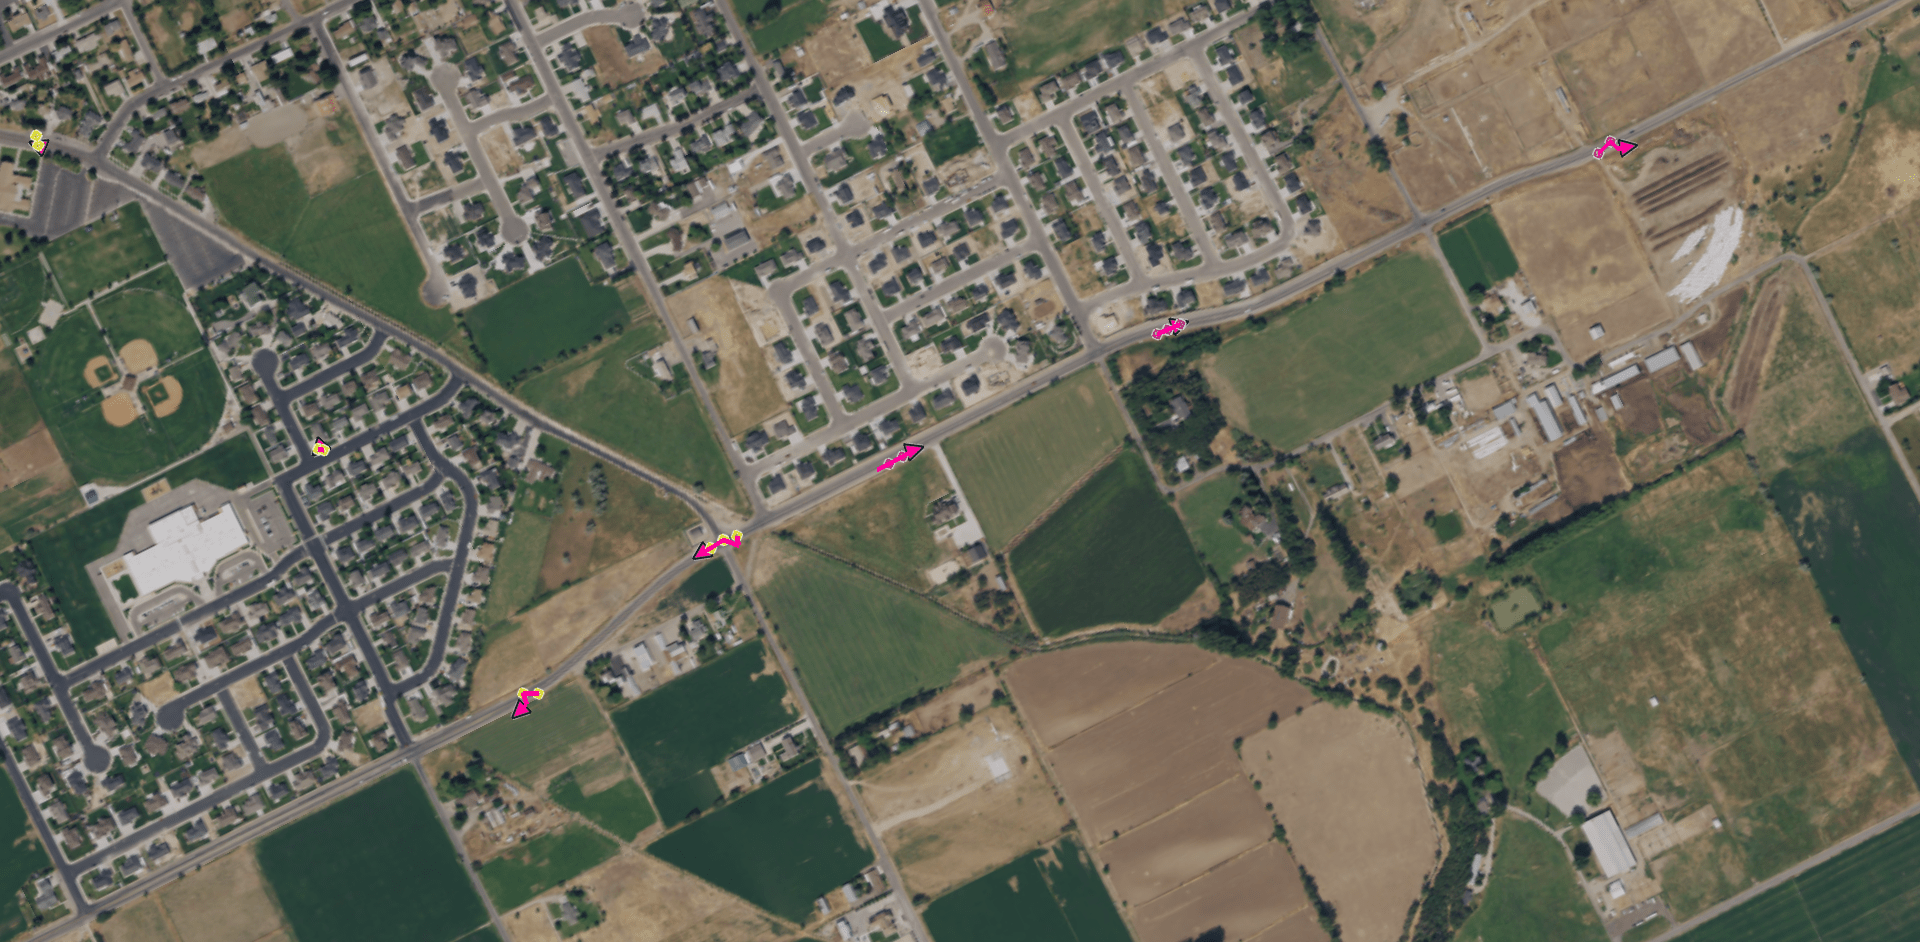
  • Yellow dots: Detected targets moving away from the sensor
  • Faded magenta dots: Detected targets moving toward the sensor 
  • Magenta lines: Estimated tracks of specific targets based on detections
  • Magenta arrowheads: Direction of travel of tracked targets

In the screenshot below from a GMTI data collection, several targets have been detected during a circular scan of an area of interest.
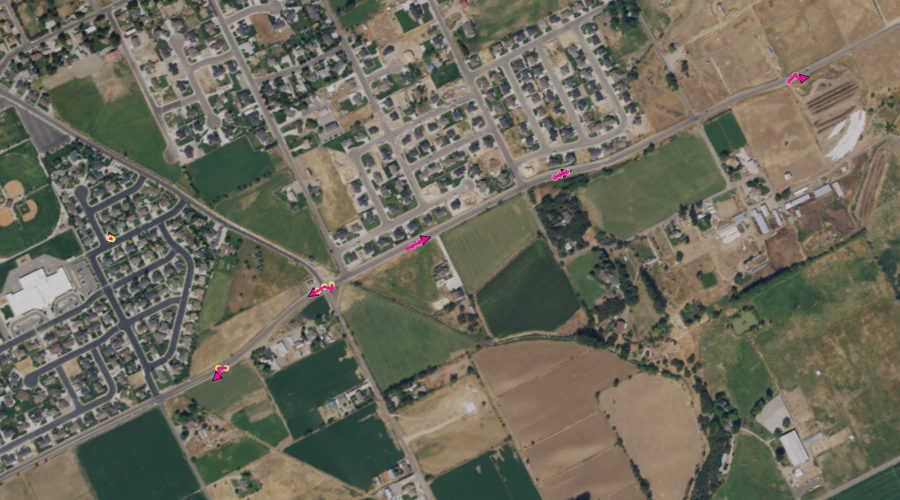
2022 GMTI Screenshot

Lisa 3D Software Display of GMTI Processing

IMSAR’s MTI modes send out energy in pulses or “chirps” at specifically timed intervals and process the returns to measure the Doppler shift of moving targets. The radar’s processing manipulates the returns to distinguish moving targets from non-moving background clutter. The system then uses complex processing technology to track moving targets and provide the user valuable data about the tracks, including the following information:

  • Relative size of targets
  • Speed of targets
  • Heading and bearing of targets

The screenshot below shows detections and tracks from a maritime data collection. The colored markings follow the same interpretation key as for GMTI processing described above.
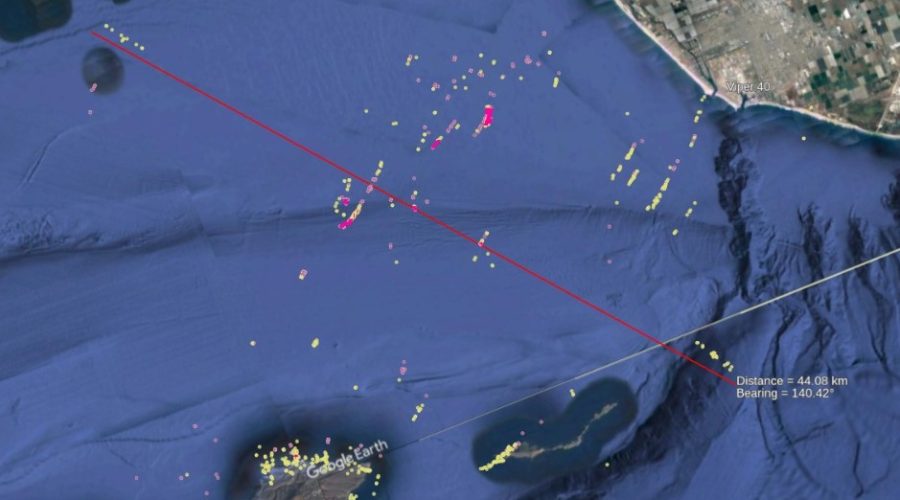
MMTI3_Jan21

Lisa 3D Software Display of MMTI Processing from an Open-Water Data Collection

Conclusion

Automated processing of radar data into products reduces the manual processing load of image analysts. To interpret the resulting products, analysts need some basic understanding of the representations displayed on the product. With a little additional training and some understanding of their mission management software, analysts will be equipped to make effective and timely decisions in various CONOP situations.

Contact us at sales@imsar.com for more information.


Related Content

Updated Sept. 24th, 2022

3.4 Taking Advantage of Mission Management Software

Knowledge Base  /  Interpreting & Analyzing Radar Data  /  Mission Management Software

3.4 Taking Advantage of Mission Management Software

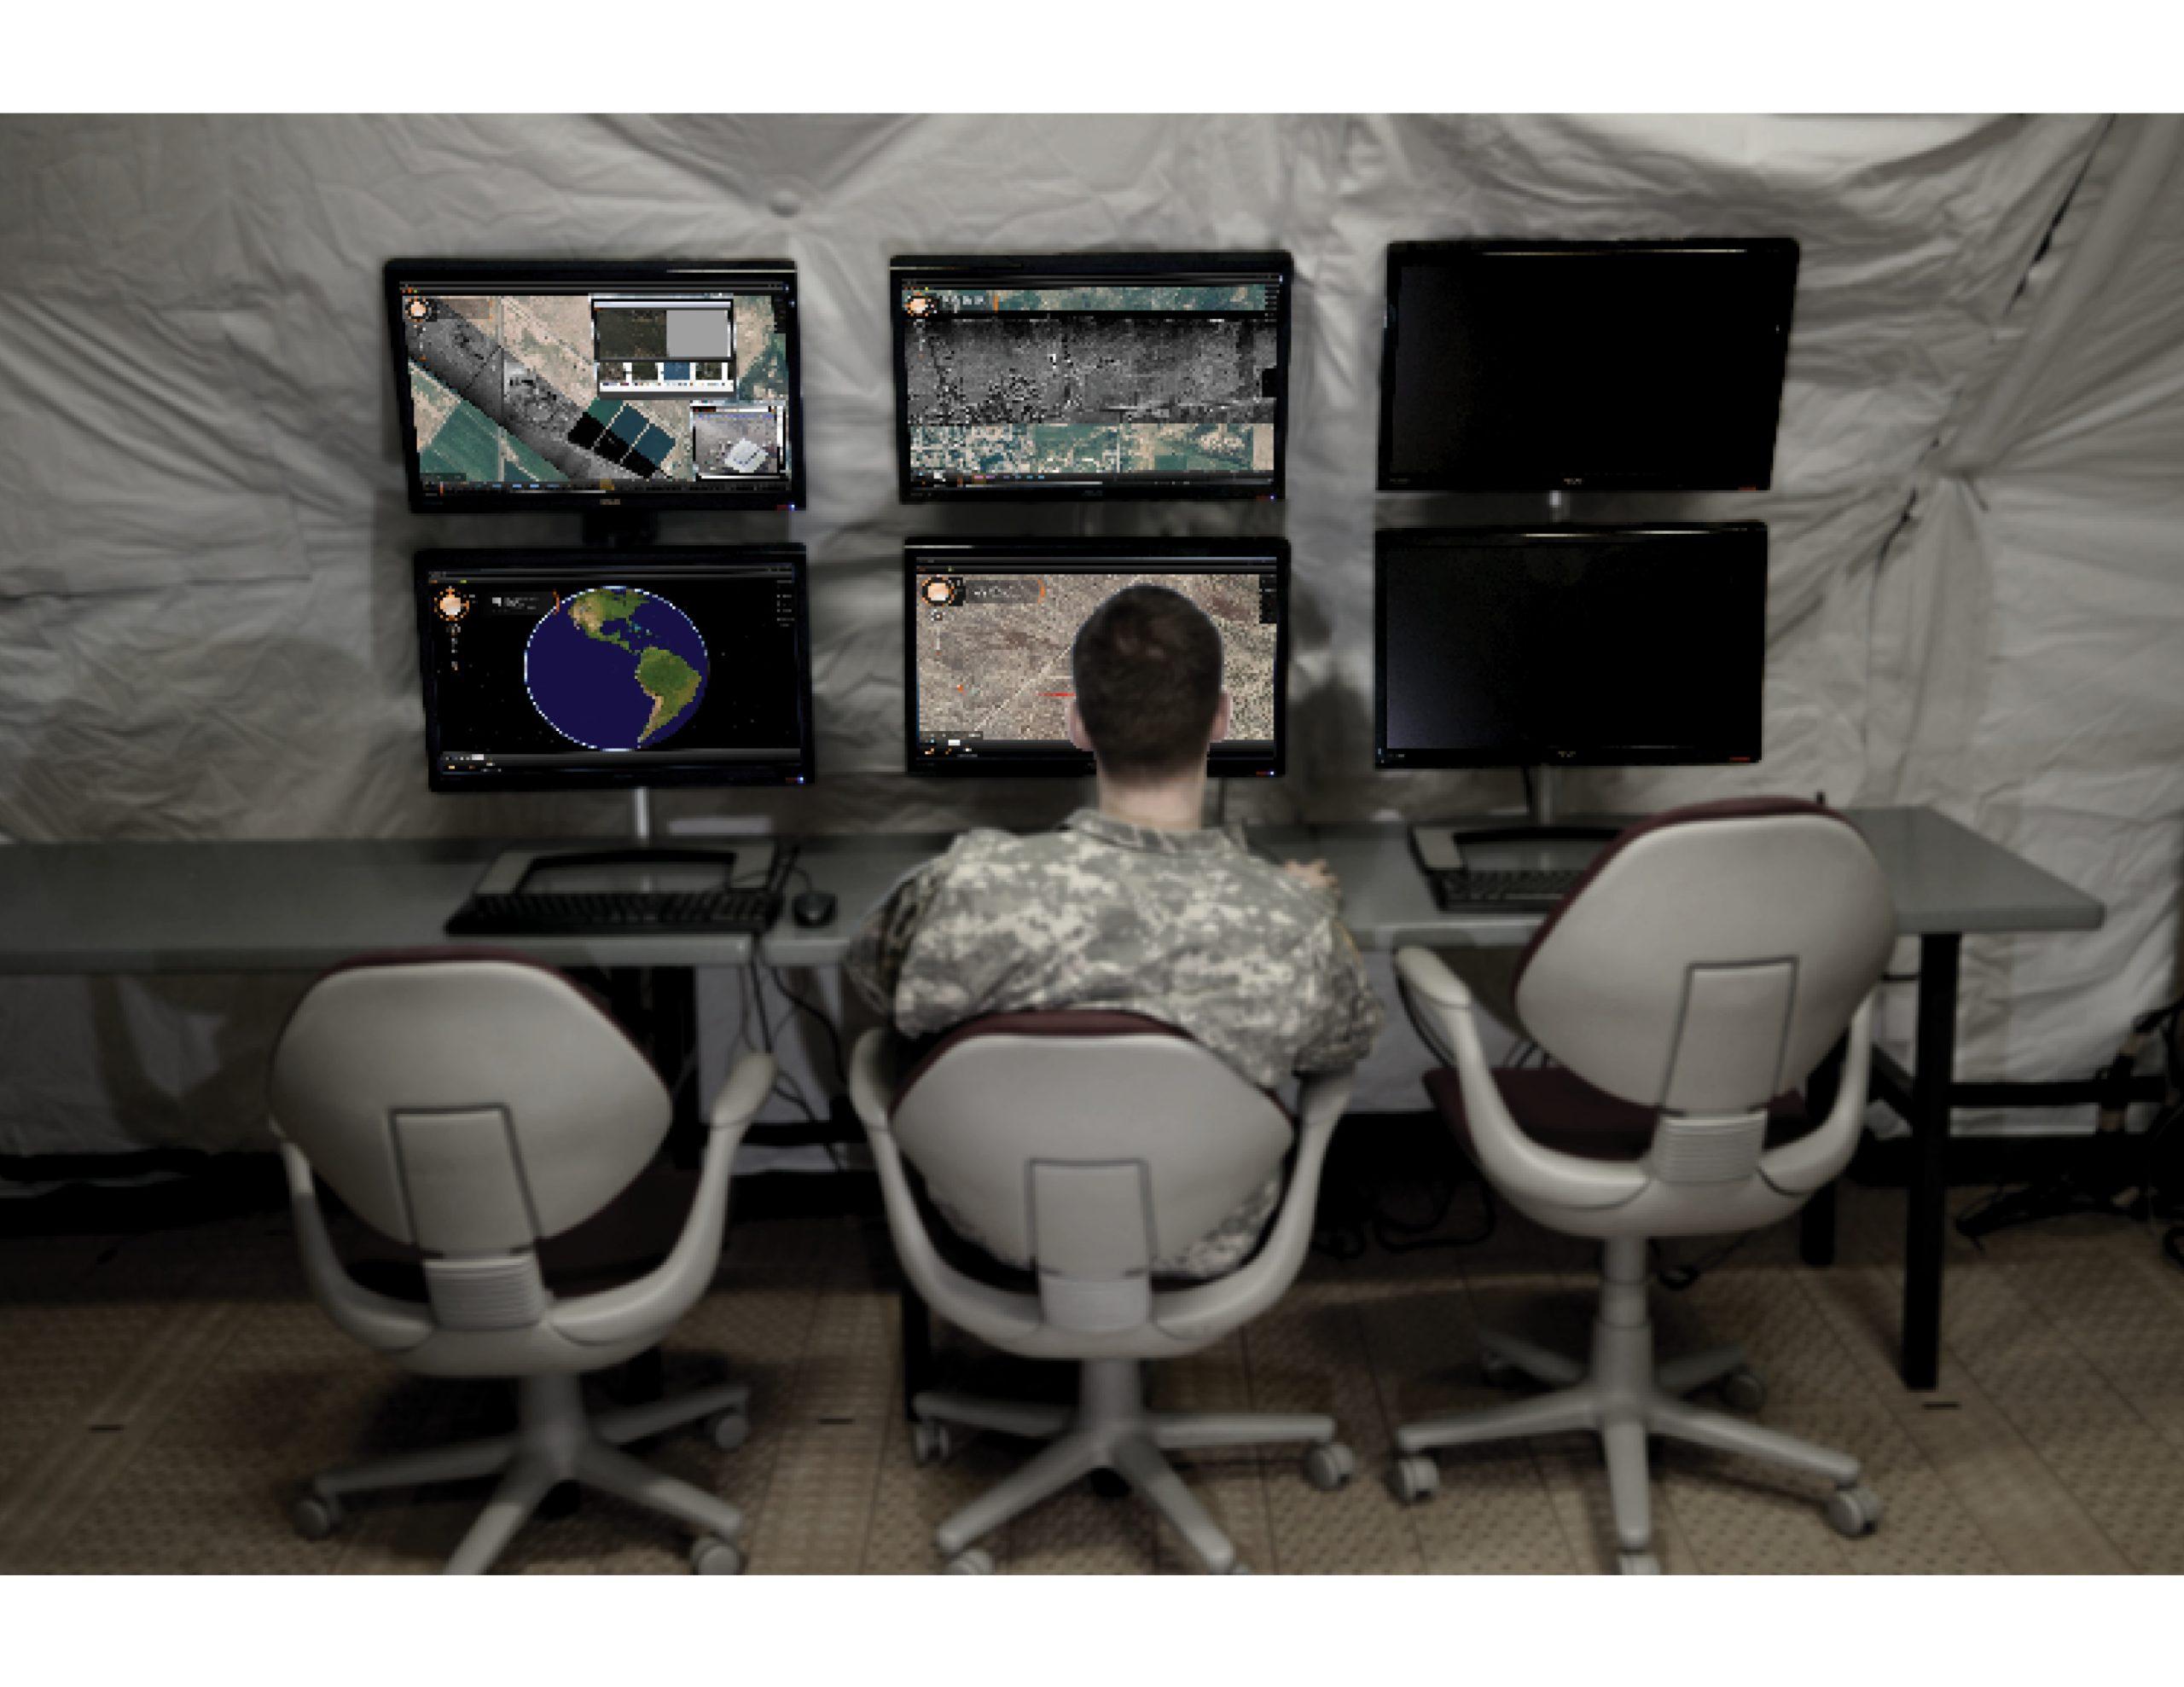
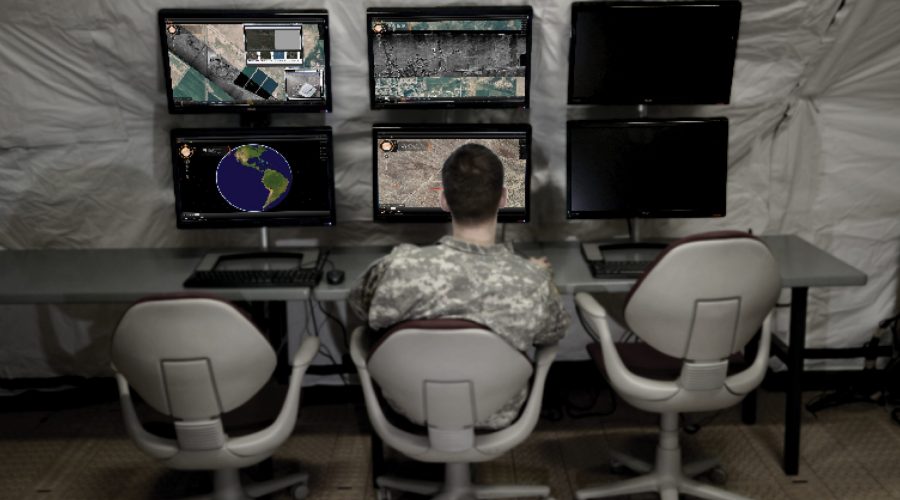
User-friendly, state-of-the-art mission management software enables radar analysts to more quickly and easily interpret data which promotes mission success. This software is available from several industry providers. IMSAR radar systems come pre-installed with Lisa 3D, IMSAR’s C2 and PED mission management software. Through its C2 functions, operators can plan flights for data collection, operate the radar, cue third-party sensors and monitor the health of the system. Through its PED functions, Lisa 3D displays data in seconds with a timeline-based workflow and intuitive search tools. Also, the software reduces operator workload by displaying data not only from the radar, but also from a variety of other sensors, such as EO/IR, FMV, and AIS.

As an alternative to using Lisa 3D for C2 functions, IMSAR radar system users have the option of using IMSAR’s Radar Control API, which allows for interoperability with other C2 ISR mission management software suites. Through the API, operators can use third-party software to slew the radar to an area of interest and immediately begin collecting data, and access data products and system status information. Additionally, IMSAR system data outputs are standards compliant, enabling data analysis in third-party PED software and the sharing of data products.

joe

Intuitive Mission Management Software Aids Data Interpretation and Analysis

IMSAR’s Lisa 3D

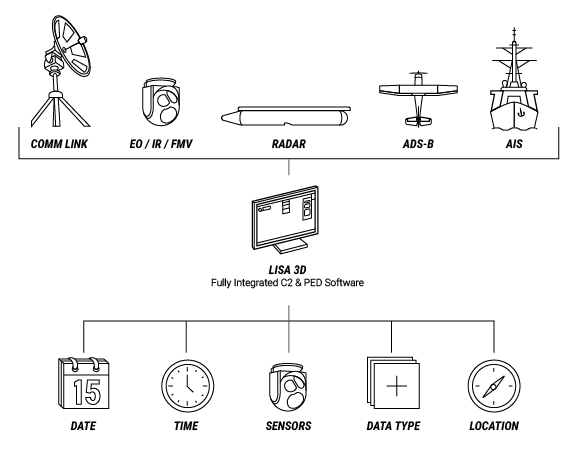
Lisa 3D software is a multifunctional tool from which operators can complete the following tasks:

  • Perform flight planning for multiple modes and sensors
  • Display flight data in real time
  • Analyze, annotate, store, and export data products
  • Search data from previous flights by collection time and date, sensor type, data product, collection area, or specific aircraft
  • Ingest and display geolocated data from GPX, shapefile, AIS and ADS-B simultaneously
3_MMS_Lisa3D_LineDrawing-05

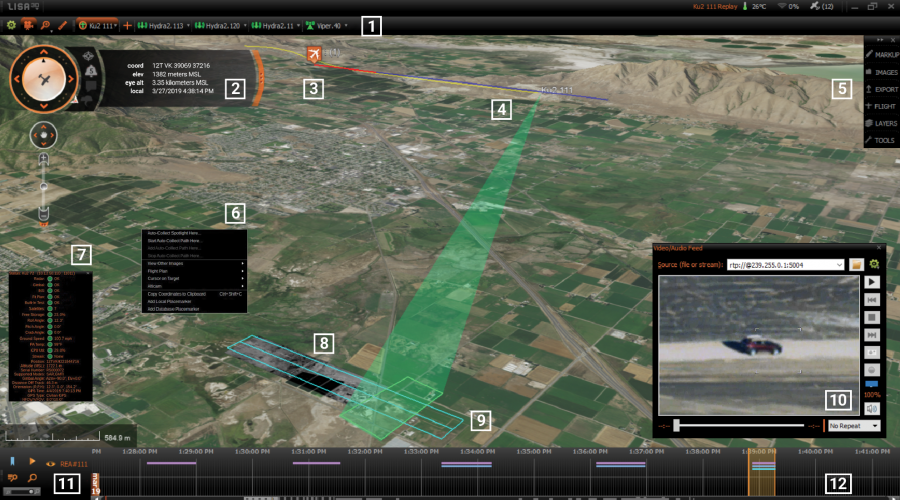
With Lisa 3D, operators can send and receive messages to and from sensors, platforms, datalinks, and other operators via embedded functions, cursor-on-target, and chat messages. During operations, Lisa 3D allows the operator to monitor data collection activities, including sensor health, flight accuracy relative to flight plan, velocity, altitude, and other flight characteristics. 

lisa3d_screenshot

IMSAR’s Lisa 3D Software Features: (1) a sensor bar, (2) a heads-up display, (3) flight planning tools, (4) asset tracking tools, (5) PED tools, (6) multi-sensor coordination tools, (7) sensor status displays, (8) real-time data displays, (9) data collection planning tools, (10) a video player, (11) search tools, (12) a timeline

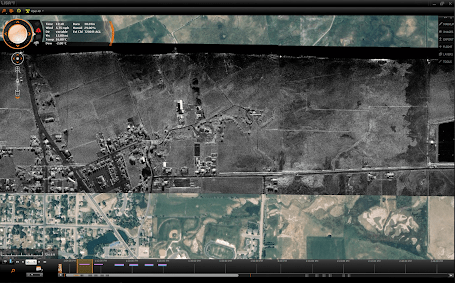
In addition, as the radar sensor data is being collected, Lisa 3D can display the data from multiple sensors superimposed on an optical basemap, including EO/IR imagery, FMV, SAR imagery,CCD imagery, and GMTI detections and tracks. This overlay feature allows the user to quickly compare data from multiple sensors to gain greater situational awareness of objects and targets of interest in the collection area. 

3_MMS_Lisa3D_SAROverlay

Lisa 3D with SAR Stripmap Data Overlaid on an Optical Basemap

Since IMSAR radars have multimode capabilities and can communicate with other sensors, IMSAR developed Lisa 3D to accept multiple data inputs. Lisa 3D can import data from virtually any sensor that has an IP address and an ability to export data. Lisa 3D can convert and display basemap imagery and elevation data in standard formats including CADRG, CIB, MrSID, SID, NITF, TIFF and GEOTIFF. Other data inputs Lisa 3D can be configured to accept include asset tracking such as AIS, ADS-B, or GPS data feeds, and it can maintain and monitor the line-of-site or beyond-line-of-site communications links to the aircraft. 

After mission specialists collect sensor data, they can use Lisa 3D to store the data and to search for the data by date, time, sensor, platform, location, and data type. Lisa 3D also has built-in filters to allow filtering by date and time, calendar date or date range, location, data, sensor type, and by several characteristics for GMTI playback including play type, speed, time window width, and GMTI track speed.

Interoperability with Other C2 and PED Software Suites

Several other mission management software suites are available on the market to help analysts interpret radar and other sensor data. Software products can be C2 only, PED only, or have both C2 and PED functionality. IMSAR customers have the option to use these third-party suites through IMSAR’s Radar Control API. The API software comes with a detailed Interface Control Document (ICD) to describe available commands and message functions to integrate other sensors or systems with IMSAR radars, and sample API messages to speed development and testing. Using the API, external C2 software can command SAR and MTI data collection activities, observe system health and status, and access all radar system data products: SAR and CCD imagery, and MTI detection and track streams. The API is designed with open standards for messaging and data products, allowing for transition to standardized formats such as OMS. In addition, IMSAR radar systems produce standard data products, allowing for third-party PED software use.

IMSAR Radar System Open Standards Interface
Standard Inputs Power and Ethernet, Radar API
Standard Data Products KML, Complex NITF, JPG, PNG, BMP, 

STANAG 4607 MTI Detects, STANAG 4676 MTI Tracks

Today’s radar sensors are linked to mission management software that displays data intuitively, helping to reduce the cognitive loads of mission specialists. Additionally, radar suppliers might offer training on interpreting radar imagery and related data products and provide in-field support to help new users get some hands-on experience. With these accessible resources, novice image analysts can quickly gain valuable skills to support critical missions without obtaining a specialized degree. 

Contact us at sales@imsar.com for more information.


Related Content

Updated Sept 14th, 2021

3. How Hard is it to Interpret and Analyze Radar Data?

Knowledge Base  /  Interpreting & Analyzing Radar Data

3. How Hard is it to Interpret and Analyze Radar Data?

While interpreting radar images does take some skill, it doesn’t take a specialized degree or certification. Even hiring a dedicated radar image analyst is not necessarily needed. Organizations can effectively integrate radar analysis into their current workflow. After dedicating a few hours to learning the basics, radar novices can begin analyzing data and providing valuable intelligence to accomplish their missions. 

Learners have several resources available to help ease the cognitive load as they gain experience with radar interpretation:

  • Fine-resolution SAR imagery that’s easier to interpret than traditional radar images
  • Leading-edge radar products that incorporate automated processing to eliminate several interpretive steps
  • Software interfaces that display data intuitively
  • Training courses

Interpreting SAR Imagery

SAR images from different IMSAR data collections

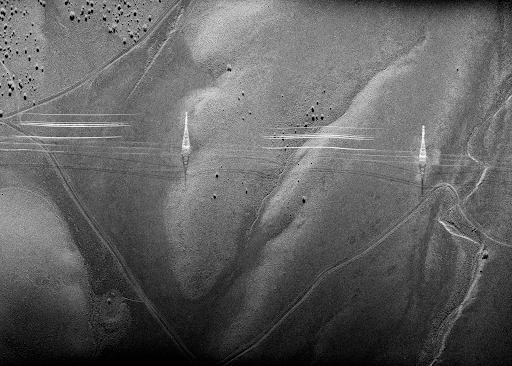
Radar images are non-literal, or in other words, they are a reconstruction of a scene, not a photo of one. While still useful, coarse or grainy radar images such as those above can create the perception that interpreting all radar data is complicated. However, fine-resolution SAR images make it easy to identify many common features and objects. In the image below, terrain, brush, and infrastructure are all easily discernible. Yet, some radar phenomena are at play in the image as well. For example, the bright outlines of the powerline towers in the image below are instances of a SAR phenomenon called layover, and do not accurately represent the dimensions and locations of the towers.  

SAR_ch3_Powerline

SAR image from an IMSAR data collect

Interpreting MTI and Other Advanced SAR Data Products

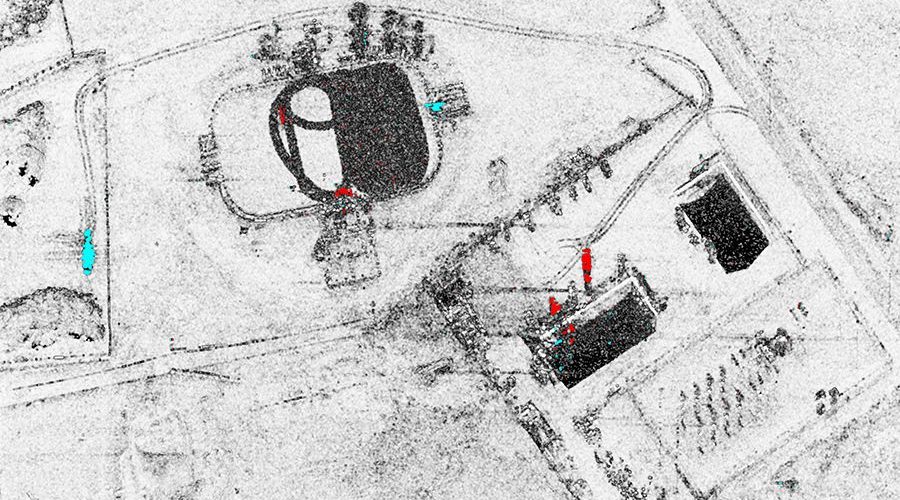
Through the multimode functionality of radar systems, some of the interpretation can be done automatically, so users are not flooded with data. Tools such as an MTI tracker and modes such as CCD/MCD process data automatically for specific uses. The resulting data products still need some basic explanations. For example, in the CCD/MCD data product shown below, data collected from two radar scans over the same area are combined to show changes between the two instances. CCD products display change as black highlights against an unchanged white background. MCD products display as “blue is new; red has fled” highlights, which is typical in change analysis.

ccd-1

CCD data product from an IMSAR radar data collection

Taking Advantage of Mission Management Software

Robust mission management software reduces operator workload by displaying data not only from the radar, but also from a variety of other sensors, such as EO/IR, FMV, and AIS. Radar users have several software options from various vendors, each with their own advantages. Since we at IMSAR are only experts on our own software, we can only reference it in illustration of how software can ease the cognitive load. Complete IMSAR radar systems not only include the sensor, but also data processing servers and mission computers installed with IMSAR’s C2 and PED software, Lisa 3D. This graphical software displays the data from the sensor within seconds of collection. 

Lisa3d_ch3

A screenshot from Lisa 3D, IMSAR’s C2 and PED software

Getting Training

Although radar analysts do not need formal certification or a specialized degree in radar, IMSAR recommends some training in radar basics. If an organization already has personnel familiar with intelligence sensors and products, they are ideal candidates for radar training. Individual courses are available through various institutions online or face-to-face. Radar companies might offer training also. IMSAR offers a 5-day training course with each radar system purchase. During IMSAR’s training, attendees learn basics similar to those presented in this knowledge base. Additionally, they get hands-on experience interpreting radar data using IMSAR’s built-in software for imaging interpretation and analysis, Lisa 3D. 

IMSAR’s demonstration team manager explains how training resulted in practical application for one customer:

Contact us at sales@imsar.com for more information.


Related Content

Updated July 27th, 2021